On Thursday morning, many screens will show Brent crude around $99 a barrel, down from about $106. Some headlines will call it a fall. It will not be one. On Wednesday 30 September the November Brent contract stops trading, and the “front month” quoted everywhere becomes December, which already trades about $7.50 lower. Nothing about the supply of oil will have changed overnight. Only the label on the price.
It already happened once this month. WTI’s October contract expired on 22 September, and most people watching a continuous oil chart never noticed that the line had quietly switched contracts. Two benchmark rolls in eight days is a good moment to explain what sits underneath the one number everyone quotes.
Oil is a curve, not a price
When you buy a crude oil future, you agree today on a price for barrels delivered in a specific month. Every month has its own contract, and each one trades at its own price. Line them up from the nearest month to the furthest and you get the futures curve. Brent and WTI are listed years ahead; the chart below shows the first eight months.
The shape of that line says more about the oil market than any single price on it. It tells you whether barrels are scarce now or plentiful now, and how long the market expects that to last.
Backwardation and contango
Backwardation
Near months trade above later months. The curve slopes down. Buyers pay a premium for oil now: supply is tight, inventories are low, and nobody wants to wait. That is today’s market.
Contango
Near months trade below later months. The curve slopes up. Oil is plentiful now, storage fills up, and the later price has to cover the cost of tanks, insurance and money. That was April 2020.
A normal, calm oil market often sits in mild contango or close to flat. What we see now is not mild. Brent’s November contract is $7.52 above December, December is $3.52 above January, and the curve keeps falling for more than a year. The steepest part is right at the front, which is exactly where the Strait of Hormuz disruption bites: the shortage is in barrels available now.
The gap between Brent and WTI tells a similar story. Brent is seaborne crude priced in the North Sea and competes directly for the tankers and cargoes that Hormuz affects. WTI is landlocked American crude delivered in Oklahoma. It is no surprise that Brent’s front end is under far more strain: its first two months are $7.52 apart, WTI’s only $3.56.
Why the headline price lies during expiry week
News sites and most charts quote the “front month”: the nearest contract that still trades. They keep quoting it until its very last day. The market does not wait that long.
Anyone who has traded crude futures knows the pattern. Four or five trading days before expiry, the volume moves out of the expiring contract and into the next one. Funds, index trackers and ETFs roll their positions on published schedules well before the last day, and speculators who have no use for physical barrels get out while there are still buyers. What is left in the expiring contract during its final days is a thinning group of traders, often commercial players settling physical business, plus anyone who waited too long.
You can watch it happen. On CME this morning, three weeks before its expiry, WTI November had traded 50,622 contracts against 21,755 in December: the volume is still firmly in the front month. In the week before 20 October, that ratio will flip. Brent’s November contract, one day from expiry, is already on the other side of that line.
So for most of expiry week, the number in the headlines is the price of a contract that has already been abandoned by most of the market. The real price discovery is happening one month further out.
Everything that expires around delivery
Expiry is not one event. It is a cluster of deadlines, and options come first.
| Date | What expires | Why it matters |
|---|---|---|
| Tue 22 Sep | WTI October futures | Last week’s quiet roll on US crude |
| Fri 25 Sep | Brent November options | Expire three business days before the futures |
| Wed 30 Sep | Brent November futures | Headline Brent switches to December |
| Thu 15 Oct | WTI November options | Expire three business days before the futures |
| Tue 20 Oct | WTI November futures | Headline WTI switches to December |
Options expire first. Monthly oil options on both exchanges stop trading a few days before their futures. In-the-money options turn into futures positions, and traders who sold options stop hedging them. In the run-up, prices often gravitate towards strikes where large option positions sit, and that pull disappears once the options are gone. For the few days between options expiry and futures expiry, the expiring contract is thinner still.
Delivery works differently on each side of the Atlantic. WTI is physically delivered: whoever still holds a long November contract at expiry must take barrels at Cushing, Oklahoma, during November, with pipeline and tank space to receive them. Brent settles against the ICE Brent Index, with the option of physical delivery through an exchange-for-physical. That difference explains a lot of history.
The extreme case: April 2020. On 20 April 2020, the day before the May WTI contract expired, it settled at minus $37.63 a barrel. Demand had collapsed with the pandemic, storage at Cushing was close to full, and holders of the expiring contract who could not take delivery had to pay someone to take it off their hands. The CFTC later pointed to thin liquidity and extreme price speed in the final hour before settlement. The next month’s contract, where the real market had already moved, stayed positive throughout. It was the clearest demonstration ever that the front month and “the oil price” are not the same thing.
The spread that will “move” on Thursday
The popular Brent–WTI spread will jump too, and for the same mechanical reason. Compare what each headline pair actually measures:
Brent and WTI prices here come from two exchanges at slightly different times this morning, so treat the spreads as approximate. The point stands: whenever you compare Brent and WTI, check that both prices are for the same month.
Why ETF holders should care
An oil ETF cannot hold barrels, so it holds futures and has to roll them every month: sell the expiring contract, buy the next. The shape of the curve decides whether that roll quietly helps or hurts, regardless of what the oil price does.
- In backwardation, the fund sells the expensive near month and buys the cheaper next one. Selling November Brent at $106.31 to buy December at $98.79 buys about 7.6% more barrels for the same money. If the curve stays where it is, that later contract tends to drift up towards the spot price as it approaches expiry: a positive roll yield.
- In contango, it is the other way round. The fund buys ever more expensive contracts and loses a little every month, even if spot oil goes nowhere. In 2020 this is what hurt oil ETF holders so badly.
That is why an oil ETF can lag or beat the oil price you see in the news by a wide margin over a year. It does not track “oil”. It tracks a rolling position on the curve. Our commodity ETF guide lists WTI and Brent funds such as USO, BNO and the WisdomTree oil ETCs, with the structure of each: check whether a fund holds the front month or spreads its holdings further out.
What this means for gold and silver
The same mechanics run through precious metals futures, only more gently. Gold’s curve normally slopes slightly upward, because holding gold costs money: the price of later months reflects interest rates and storage. When rates are high, as they are now, that slope is steeper. A flat or inverted gold curve is rare, and when it appears it signals real physical tightness. It is one of the quieter indicators worth watching.
It is also why our silver note quoted the December contract: that is where silver’s volume is, not the nearest month on the calendar.
Copper: one metal, two curves
If oil shows how a curve moves through time, copper shows how it can split by place. The same metal trades in London on the LME and in New York on COMEX, and on 28 September the two curves pointed in opposite directions.
London: tight now
LME cash copper at $14,544 sits about $92 above the three-month price, and October to March drifts slightly lower. Mild backwardation: metal in London is still wanted now, weeks after a squeeze that took the cash-to-three-month spread above $550 a tonne in late August.
New York: plenty now
COMEX rises every month, from $6.57 a pound in October to $6.74 in March, about 2.6% in five months, or roughly 6% a year. That is close to full carry: the price of storing and financing metal that is already there. COMEX warehouses hold close to 700,000 tonnes, far more than the LME.
Put side by side, the gap between them grows month by month. For October delivery, New York is only about $33 a tonne above London, close to the long-run average of the two markets. By March the premium is about $429.
One reading: the near months reflect copper that is already in place, with New York well stocked and London still short. The later months carry a growing probability that the United States puts tariffs on refined copper, which would lift US prices above the world’s. Metal was shipped from London to the US all summer to get ahead of exactly that. The spot price, around $6.53 a pound this morning, shows none of it. The curves show all of it.
How to read a curve properly
- Follow the most active contract, not the continuous front month, and switch four or five days before expiry, as the market does.
- Watch the first two months. The gap between them is the market’s live reading of how scarce oil is right now. When a $7.50 gap narrows towards $2, the shortage is easing, even if the headline price barely moves.
- Mark the expiry calendar. Options first, futures a few days later. Big moves in the last days of an expiring contract often say more about who is stuck than about supply and demand.
- Compare like with like. Same month, same benchmark, same day, before you draw a conclusion.
- Compare exchanges, not just months. When the same commodity has two curves that disagree, as copper does now, the gap is information: about stocks, trade flows and policy.
The other side: a price that is really moving
This article opened with a move that is not a move: Brent’s headline price dropping about $7.50 on Thursday only because the quote switches from November to December. WTI shows the opposite. Its November contract does not expire until 20 October, so nothing mechanical is happening to it this week. Every dollar it moves on the chart below is real price discovery, driven by headlines, inventories and positioning.
Here is how that looks on 29 September, on the hourly chart of WTI November. This is the map we are watching, posted here first. Levels, not advice.
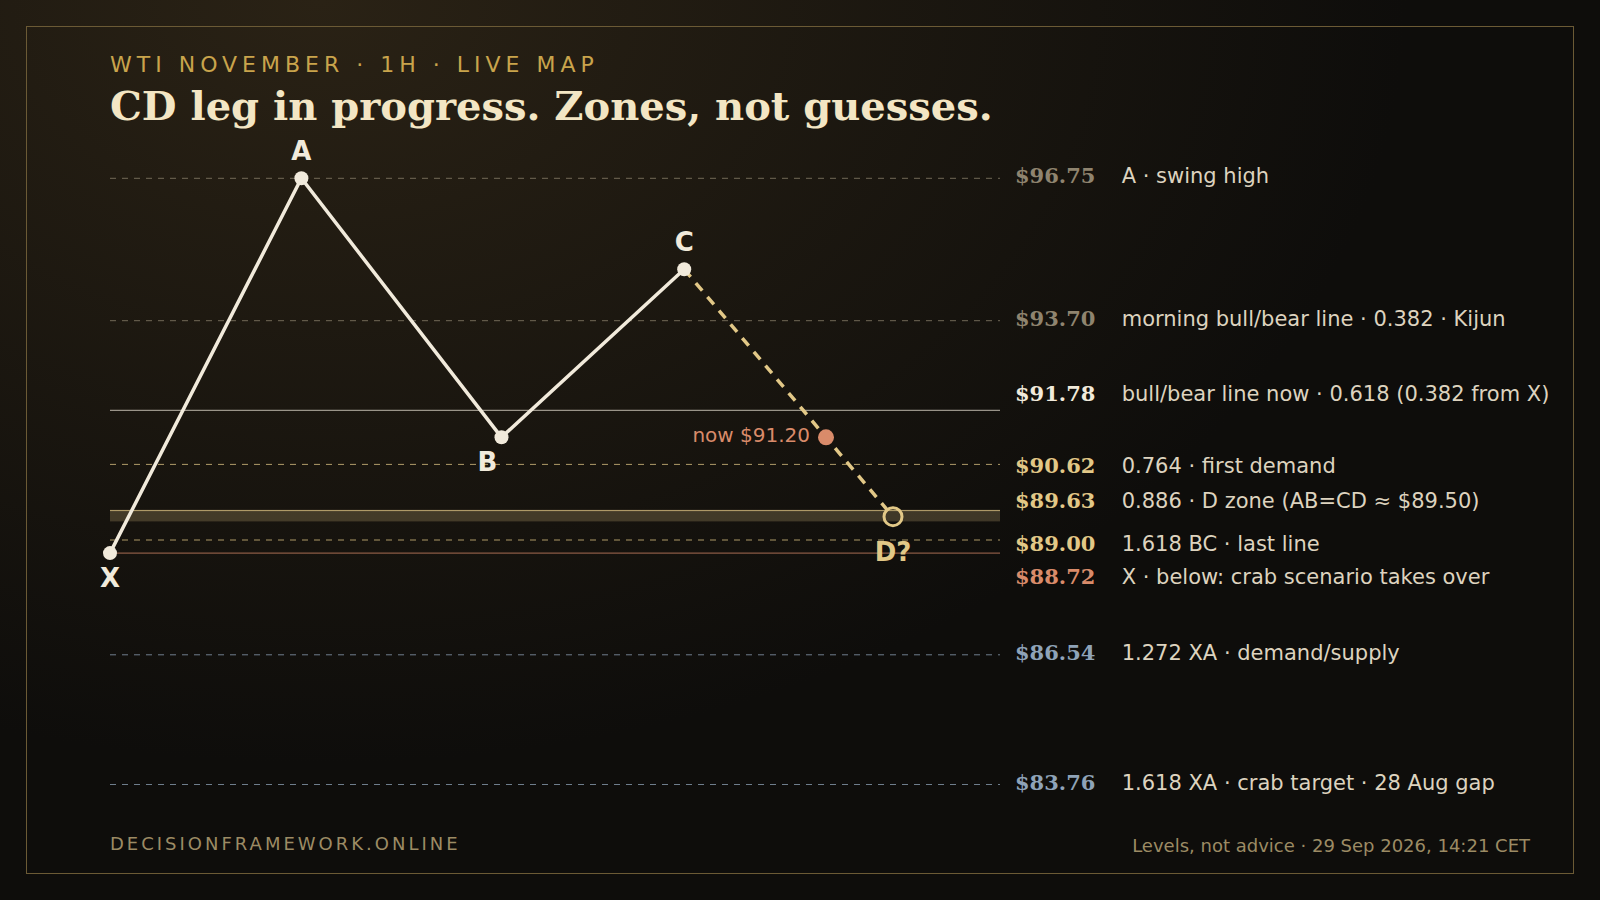
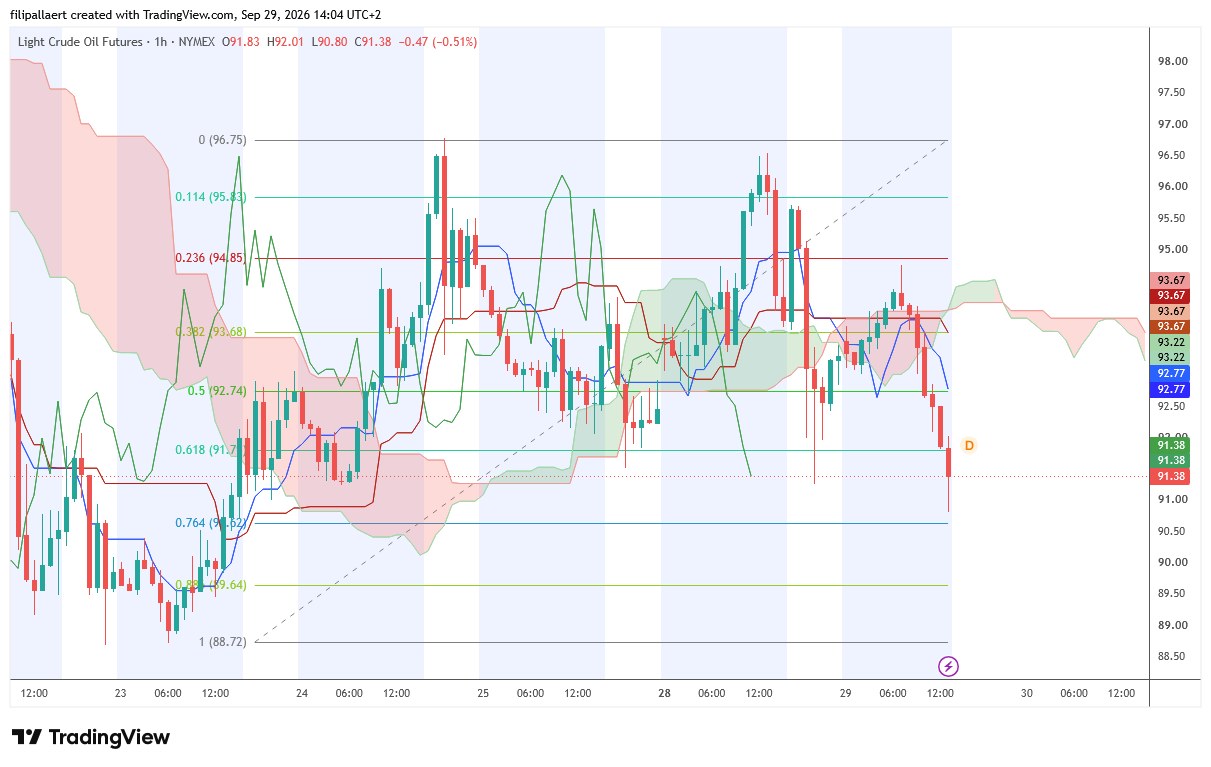
- The structure. X $88.72, A $96.75, B about $91.20, C about $94.80. The CD leg down is in progress.
- The bull/bear line. $93.70 this morning; with price below it, $91.78 (the 0.618 retracement, or 0.382 from X) now takes that role.
- The D zone, $89.40–89.65. AB=CD completes near $89.50, within 25 cents of the 0.886 retracement at $89.63. First demand sits at $90.62; the last line is $89.00.
- Below X at $88.72, the picture changes rather than ends. The Gartley/bat reading gives way to a possible crab, with the XA extensions as the next levels: $86.54 (1.272, a demand/supply zone) and $83.76 (1.618, the crab completion, level with an unfilled gap from 28 August).
- Catalysts. US inventory data (API tonight, EIA on Wednesday at 16:30 CET), Brent November expiry on Wednesday, and Hormuz headlines. On the hourly Ichimoku, price is still below the cloud: the trend has not turned.
WTI November trades at $90.47, below the first demand level at $90.62. The CD leg is progressing towards the D zone at $89.40–89.65.
Worth noting: WTI’s gap of 28 August came right around the previous Brent expiry. Brent November expires on 30 September, so Thursday 1 October is worth watching for the same effect.
Wednesday 30 September: Brent November expires. From Thursday, expect headline Brent near December’s price, around $99 at today’s levels. If you see “oil falls below $100”, check which contract is being quoted first.
Write it down
Next time you read that oil “jumped” or “fell”, write down three things before you react: which contract, how many days to its expiry, and what the gap to the next month is doing. If you can’t answer the first two, the headline hasn’t told you anything yet.
Get market notes like this by email
Short notes on the moves and mechanics that matter, from a trader’s point of view. Subscribers also get the free preview of The Gold Investor in their language, and the full book for €35 instead of €38.
You'll get a confirmation email first. Occasional emails on gold, real rates and the dollar. Unsubscribe anytime. Or read the preview first.
Sources
- ICE Futures Europe, “Brent Crude Futures”, contract specifications (last trading day, EFP delivery and cash settlement against the ICE Brent Index).
- ICE Futures Europe, “Brent Crude American-style Options”, contract specifications (expiry three business days before the futures).
- CME Group, “Light Sweet Crude Oil (WTI) Futures and Options”, fact card (termination of trading, physical delivery at Cushing, options expiry).
- Oilprice.com, “Brent Crude Oil Futures Contracts” and “WTI Crude Oil Futures Contracts”, curve prices, 29 September 2026.
- CME Group, “Crude Oil Futures quotes”, prices and volume by contract month, 29 September 2026, 04:17 CT.
- Trading Economics, “Brent crude oil”, 29 September 2026.
- CFTC, “CFTC Staff Publishes Interim Report on NYMEX WTI Crude Contract Trading on and around April 20, 2020”.
- Morgan Downey, Oil 101, “When Oil Went Negative”.
- CME Group, “Copper Futures quotes”, prices, prior settlements and volume by contract month, 28–29 September 2026.
- London Metal Exchange, “LME Copper: trading summary”, official and closing prices, 28 September 2026.
- MINING.COM, “Copper price holds near record as London warehouse bidding war looms”, 14 August 2026.
- Discovery Alert, “Copper hits $14,533/t record as tariff arbitrage drains LME stocks” and “Copper price signals tightening as LME stocks fall”, September 2026.
- Trading Economics, “Copper”, 29 September 2026.
Prices are as reported at the time of writing and move quickly. Expiry dates follow the exchange rules; check the official ICE and CME expiry calendars before trading, as holidays can shift them. Educational content to support your own research and decisions. Not financial advice.